Bidding reports
The bidding reports page provides one dedicated place to review all your in app bidding activity with unique real time bidding KPIs. You can use the filters and breakdowns to analyze your bidding activity.
KPIs on the bidding reports dashboard
ironSource provides deep insights into your app’s in-app bidding monetization with metrics that allow you to understand how well your ad units are performing, which ad source is most profitable, etc.
All the KPIs provided in the bidding reports relate to the bidding flow and the auction itself.
- Bid Requests – The total number of times an ad source was requested to offer a bid
- Bid Response – The total number of times an ad network responded to bid requests
- Bid response time – The average time takes an ad network to respond to a bid request
- Wins – The total number of times an ad source won the auction and loaded the ad successfully
- Bid Rate – Total number of bid responses divided by total number of bid requests
- Win Rate – The total number ad source wins divided by the total number of bid Responses
- Render Rate – The total number of impressions divided by the the total number of bid responses
- Revenue – The total revenue generated by your bidding ad sources
- Revenue SOV – SOV (share of voice) reflects the bidding ad sources’ revenue share compared to total revenue from both bidding and non-bidding ad sources
- Impressions – The total number of times the ad is shown
- eCPM – Effective cost per thousand Impressions; calculated as (Revenue / Impressions) * 1000
How to set up a bidding report
To start using bidding reports, follow these steps:
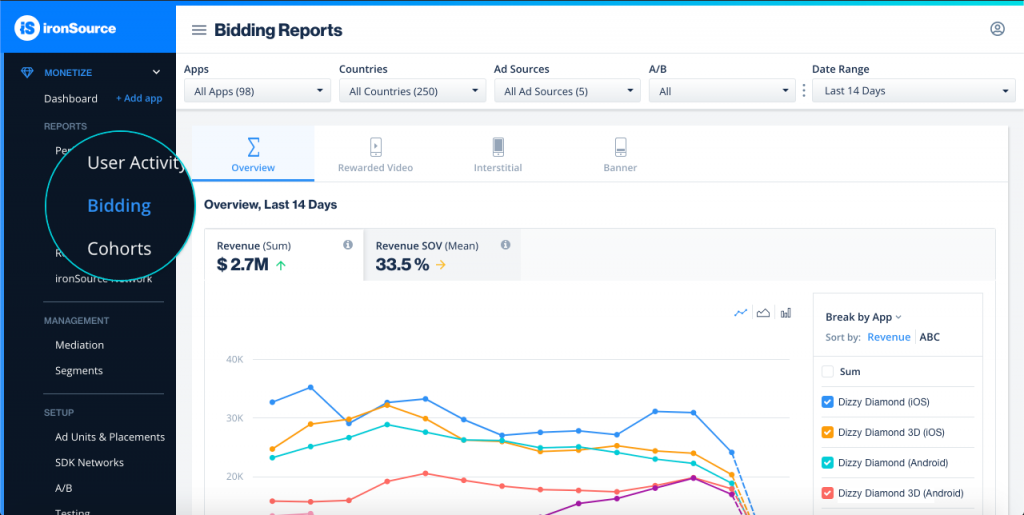
Step 1. Navigate to Monetization reports
Note: All apps with at least one bidding ad source will appear in your Bidding report. All supported bidding networks that are live on your account will be shown as well.
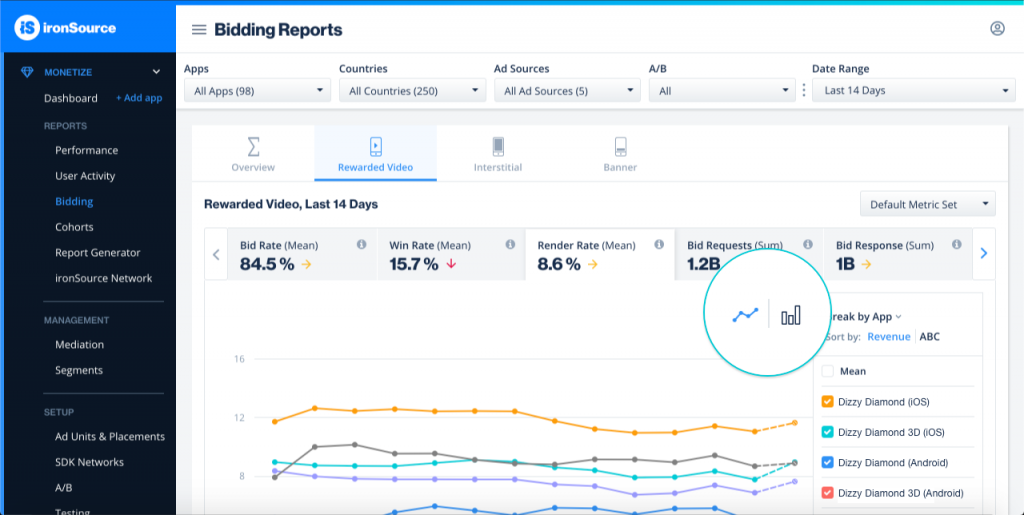
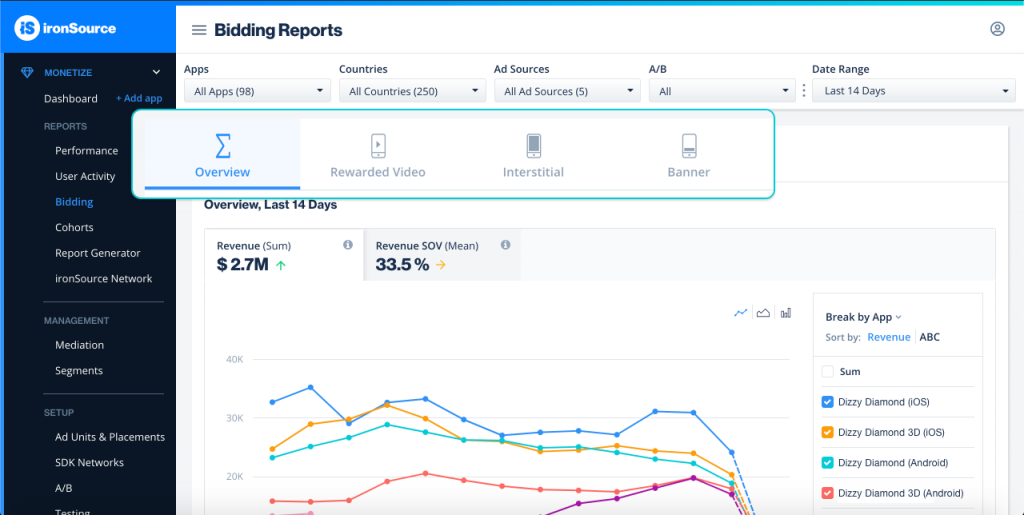
To view your bidding report, go to Monetize -> Reports -> Bidding:
Step 2. Configure Your Report
Use filters, breakdowns, tabs, and different formats to review your data and simplify reporting.
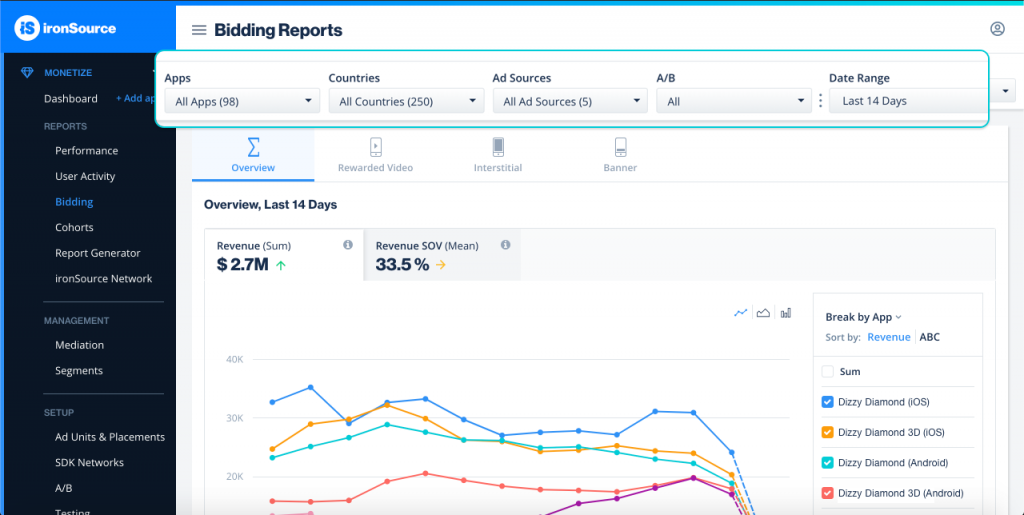
Filters
Filters make it easier to find specific results and separate the rest of the data to simplify your report. With a diverse portfolio of multiple game genres spread between different countries, zooming in with filters allows you to review one title or ad source at a time, which can be the key to understanding performance and building a plan to optimize your monetization strategy.
- Apps – View reports only for specific apps, to isolate the data for certain apps or per app you monetize with ironSource. You can choose to include or exclude certain apps
- Countries – View your apps’ performance based on geo and demographic
- Ad Sources – Understand the performance of a specific bidding network. You can choose to include or exclude certain bidding ad sources.
- A/B – View report for only group A or group B while or after A/B test
- Date Range – Select any predefined range or create a custom date range
Step 3. Define Your Metrics
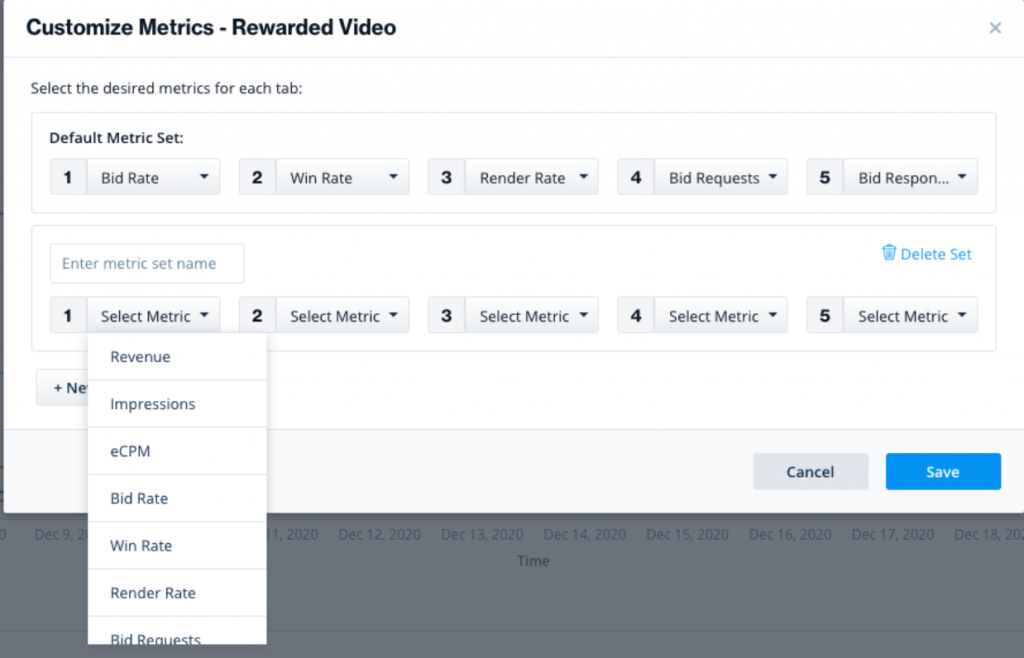
Click on each metric to see dedicated graphs for that metric. You can create custom metric sets in the individual ad unit tabs that provide granular data on your bidding performance by clicking Customize Metrics. Then you’ll be able to create your own metric set and save it for future use.
You can change the metrics for your ‘Default Metric Set‘ or add a new metric set. Your metric sets will be saved per ad unit.
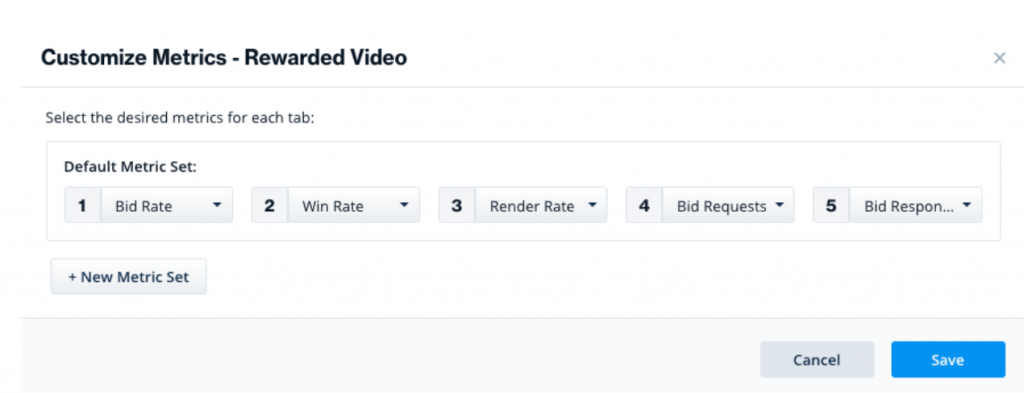
When adding a new metric set, enter a relevant name for the metric set and choose from the list (find a list of all our supported metrics below). Then click Save.
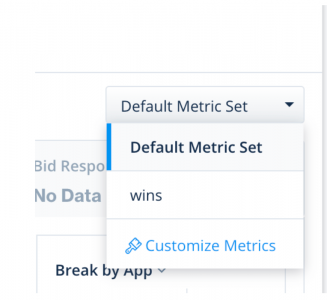
Once you save your metric set, you will be able to see it in the Metric drop-down on the top right of the graph
For relevant metrics, you will have the ability to view the data trends in lines or stacked:
Breakdowns
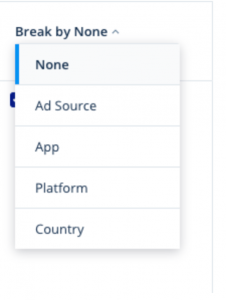
Use breakdowns to create different views of your data based on the selections you’ve chosen in the filters section. Customize the view even further by selecting how the list is sorted, as well as the checkboxes which control what you see in the graph.
- Ad source
- App
- Platform
- Country
Tabs
You can examine your reports for all ad units in the Overview tab or to view each ad unit separately simply navigate between the tabs.
Format
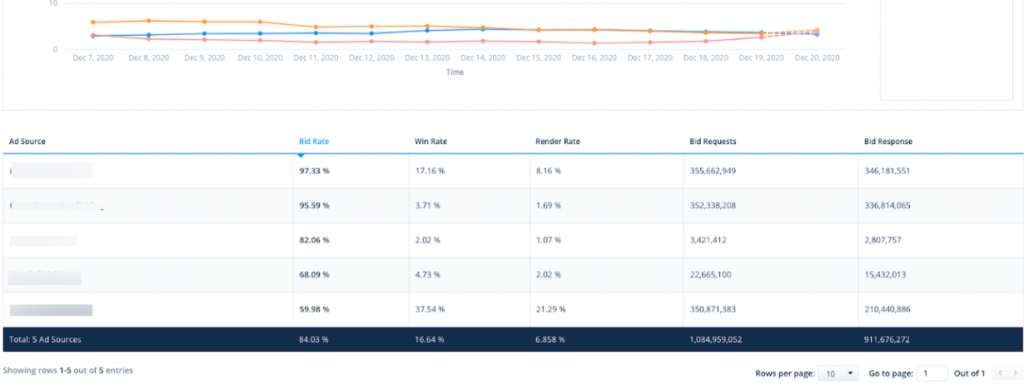
You can view your reports in graph formats.
The Graph format shows patterns of your data based on the defined breakdowns and filters. You can track your performance in a visual format, which makes it easy to understand trends and provides a nice view of the data over time, as a whole.
The Metric Totals in Table, below the graph, provides you with a summary of the metrics portrayed in your report in table format. The numbers in the table are a total of each metric, i.e. the total Bid request, Bid response, and the average metrics, i.e. Bid rate, Win rate. The table reflects the identical breakdowns and filters defined for the graph.