
ironSource Ads Performance Reports
ironSource Ads Performance Reports provide actionable insights and detailed analytics, so you can make data-driven decisions.
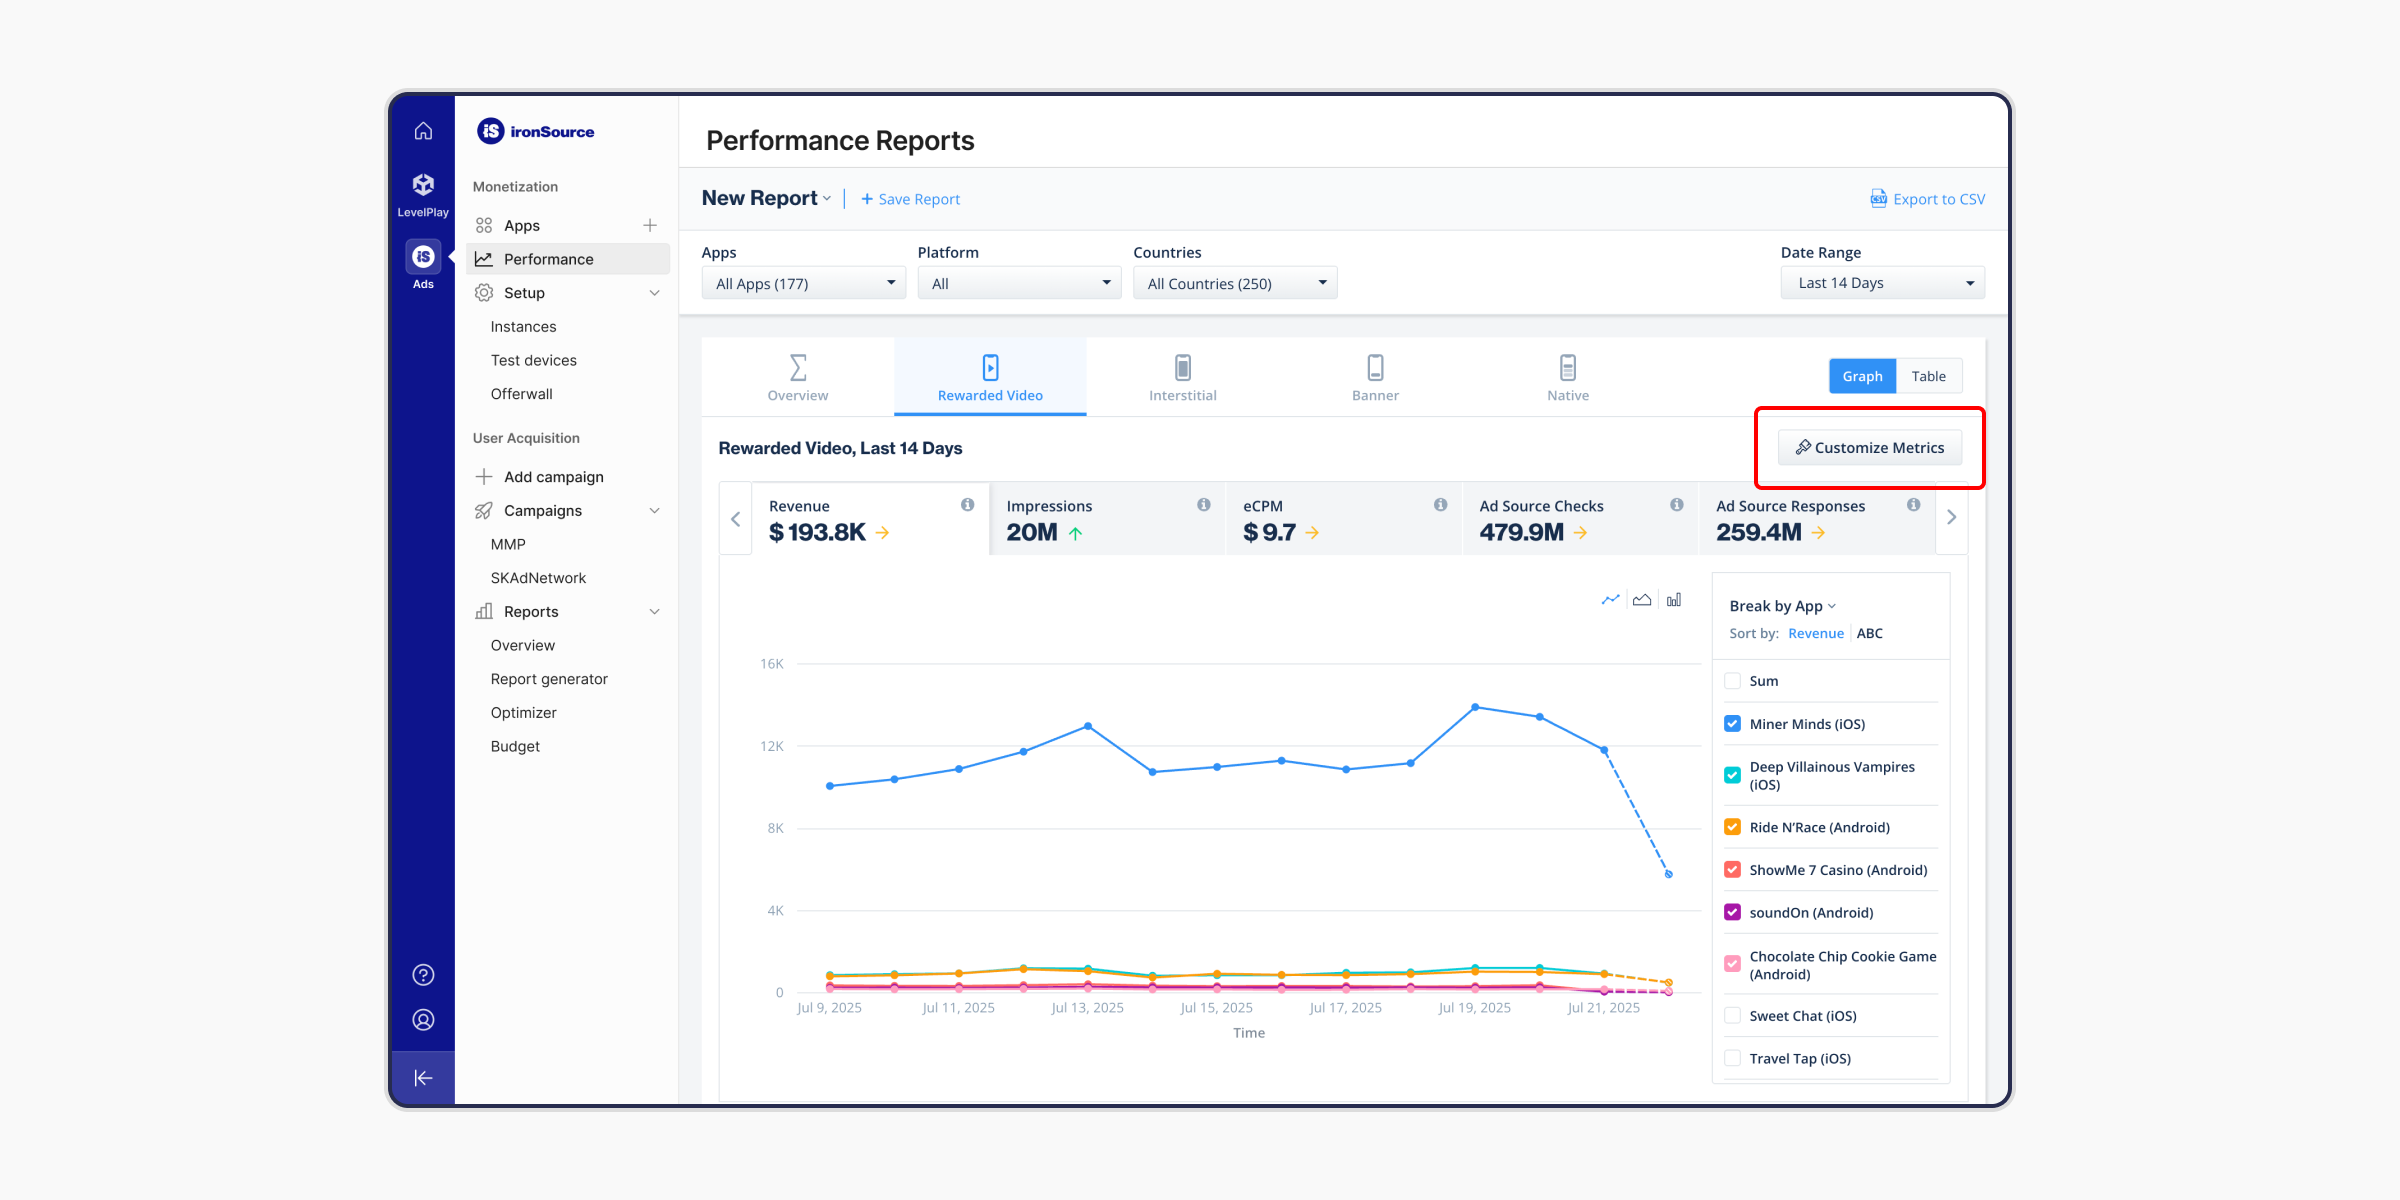
To access these reports, navigate to ironSource Ads and click on the Performance in the left side nav bar.
Key Features and Functionalities:
1. Configure your reports:
- Report Name: Customize and save your reports under your preferred name. You can also make it default so that it appears on loading the dashboard.
- Apps: Filter your reports by selecting specific apps or viewing data for “All Apps.”
- Platform: Analyze performance data across different platforms (iOS/Android) or view a combined “All” platform view.
- Countries: Segment your data by country to understand regional performance. Select specific countries or view “All Countries.”
- Date Range: Define the timeframe for your report. Choose from predefined ranges (e.g., Last 14 Days) or specify a custom date range.
- Save Report: You can use the ‘Save Report’ option at the top of the page, allowing you to save your configured reports and easily access them later.
2. Report Types:
The Performance Reports section is organized into different tabs, each focusing on the performance of a specific ad format (Overview, Rewarded Video, Interstitial, Offerwall, Banner, and Native).
3. Data Visualization:
Graph/Table View: Choose between a visual graph display or a structured table view to analyze your data.
- Graph View: The graph displays performance trends over the selected date range.
- Table View: A table displays all values in a structured format.
4. Data Breakdown:
- Use the “Break by” option to analyze data by instance, app, platform, or country, or to view the overall data without a breakdown.
- You can examine your reports for all ad formats in the Overview tab, or to view each ad format separately, simply navigate between the tabs.
5. Define Your Metrics
Click on the separate metrics to see dedicated graphs for that metric. You can create custom metric sets in the individual ad format tabs that provide granular data on your ad performance, by clicking Customize Metrics. You will then be able to create your own metric set and save it for future use.
You can change the metrics for your ‘Default Metric Set‘ or add a new metric set. Your metric sets will be saved per ad format.
When adding a new metric set, enter a relevant name for the metric set and choose from the list (find a list of all our supported metrics below). Then click ‘Save‘.
General
- You can extend the number of rows at the bottom of the table up to 500 rows.
- You will be able to see the total of the report data in the bottom row of the report.
- You can Export your report data in CSV format for further analysis and reporting.
Begin using ironSource Ads Performance Reports to enhance your analytics and optimize your ad results.