
Analysis
The Ad Quality Analysis page helps you easily monitor the impact ads are having on your app and user experience. You can quickly visualize key metrics like churn per advertiser and drill down to see if a creative should be reported to the ad source. A complete list of supported ad sources can be found here.
Navigate to the Analysis page
The Analysis page is accessible from the left side menu under Monetize, then Ad Quality.
Monitor KPIs
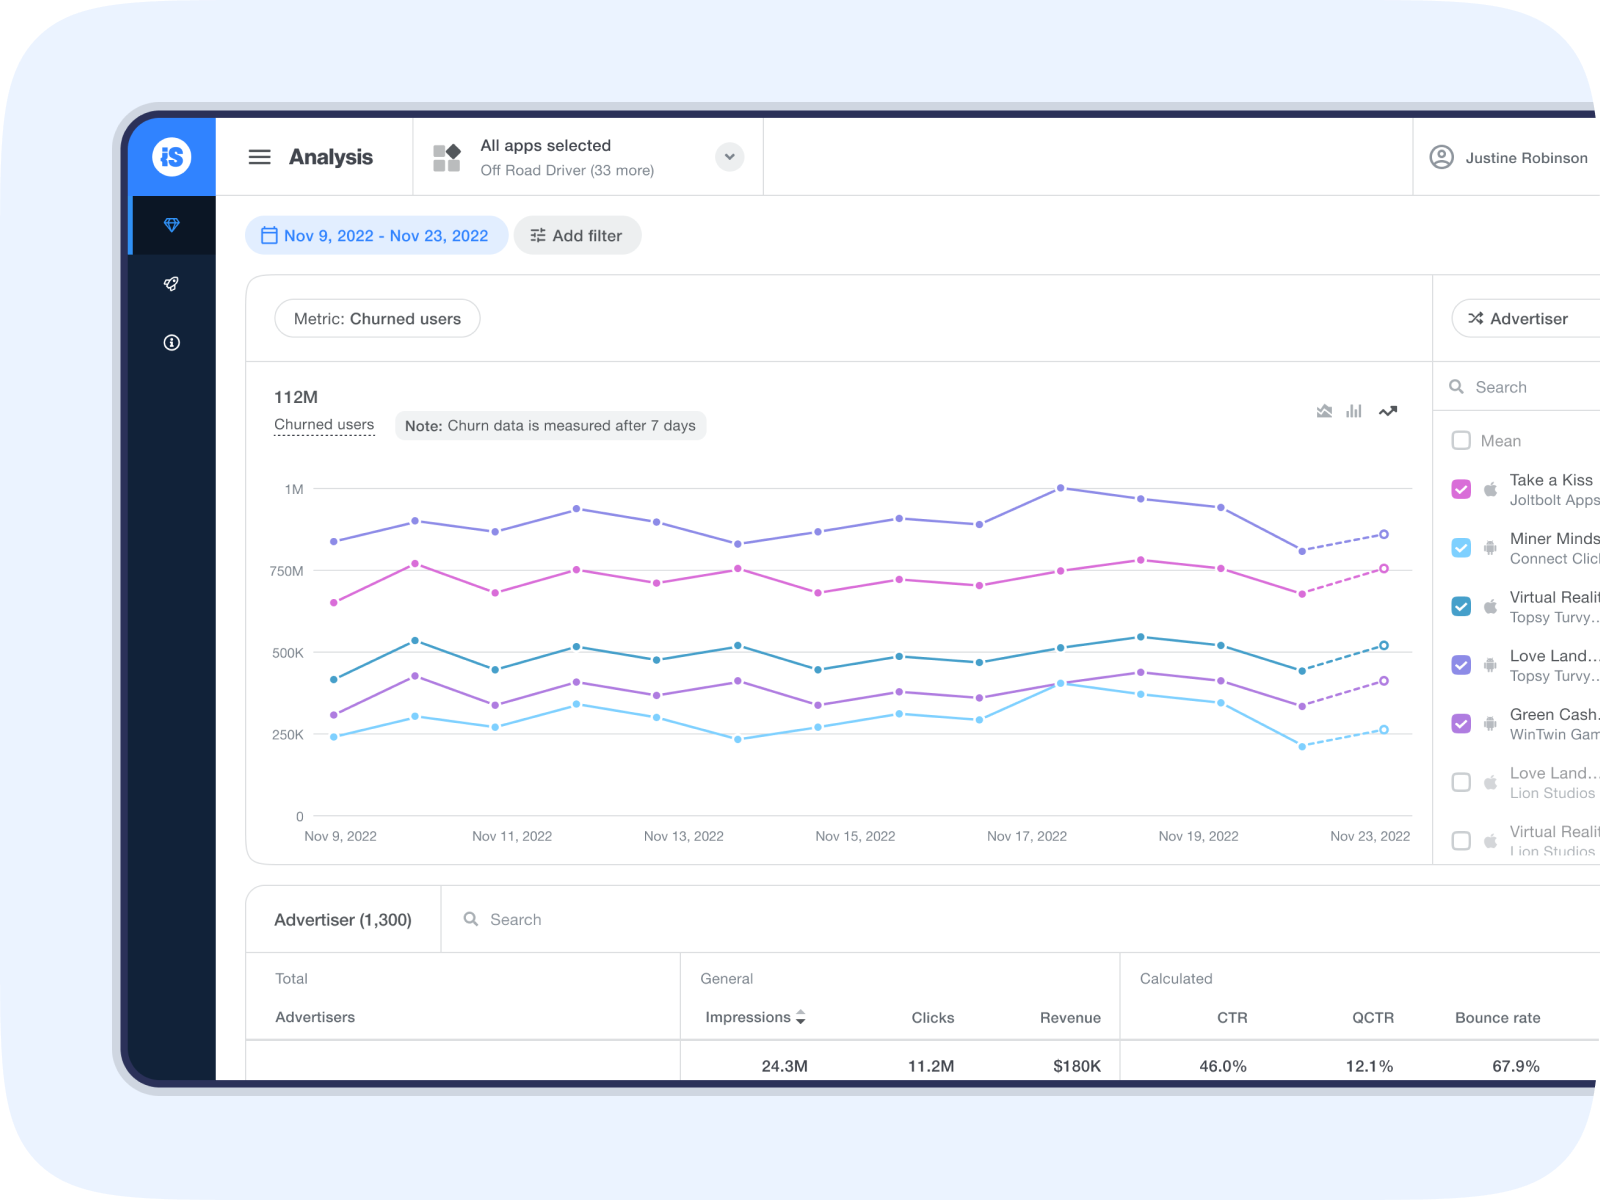
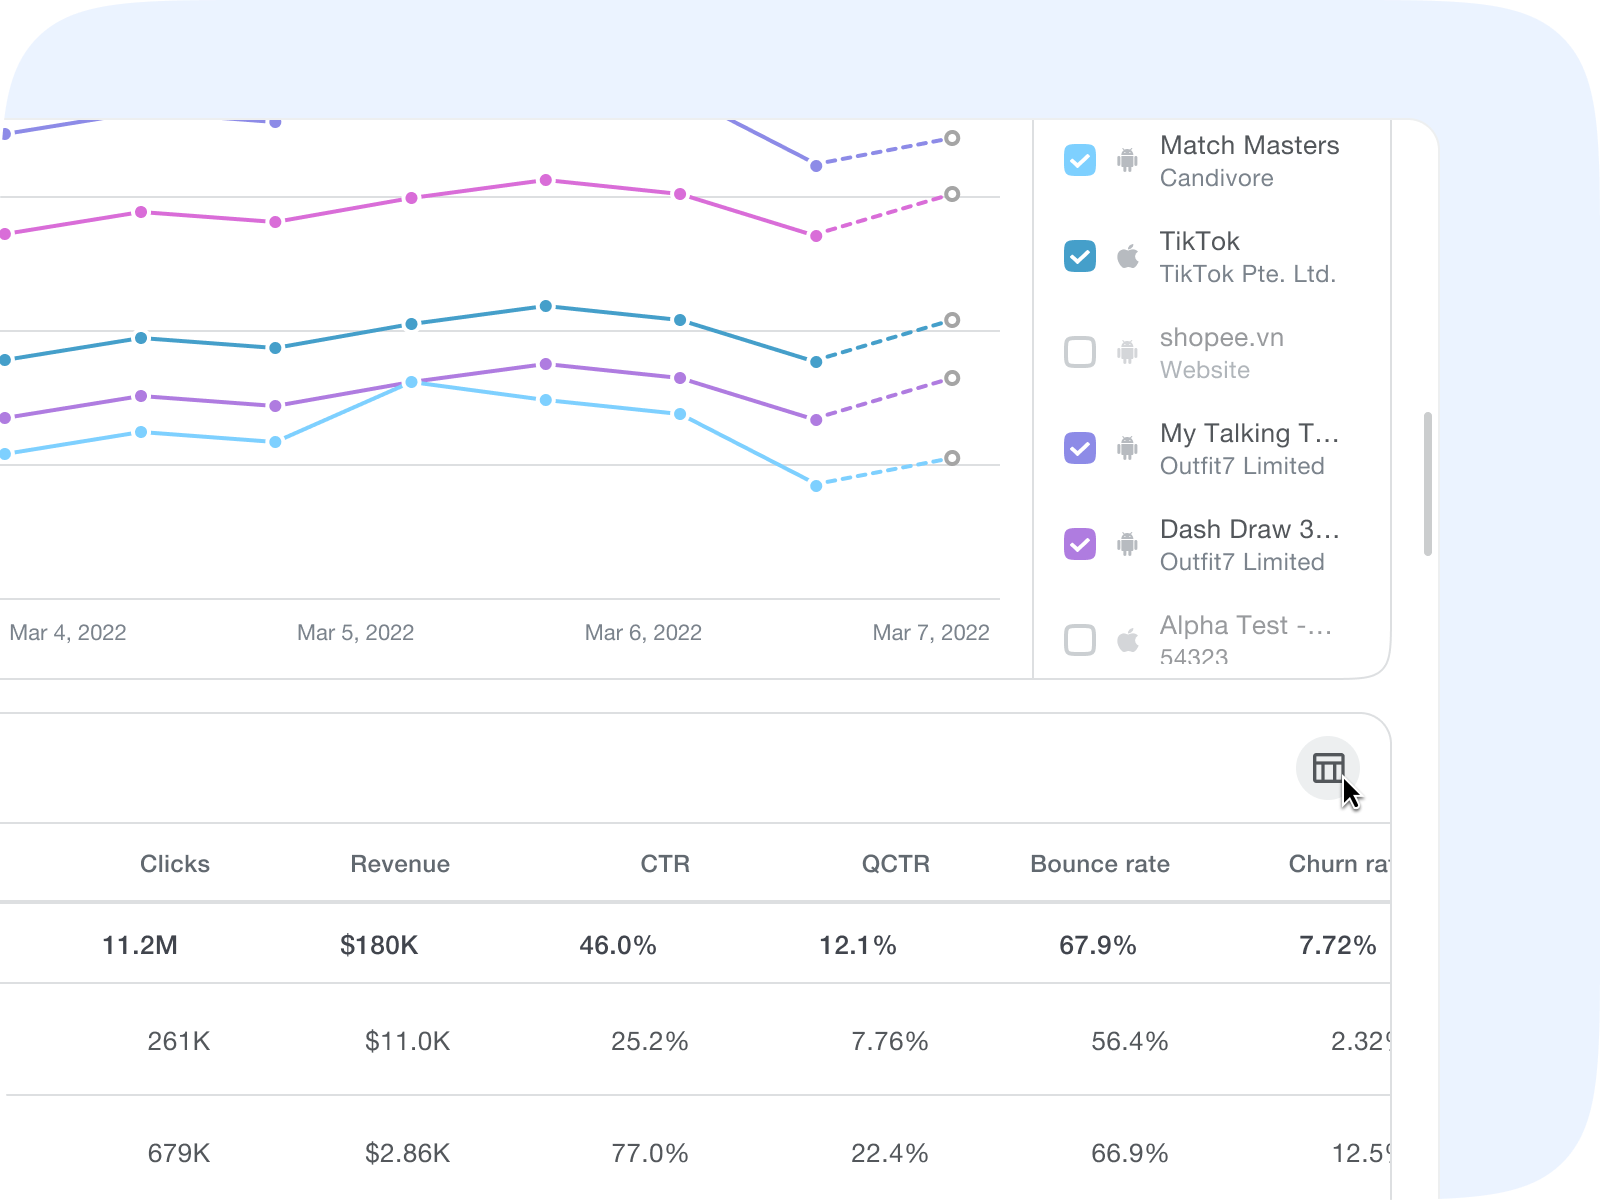
By default, the Analysis page displays a graph of the churned users D7 per advertiser so you can instantly see which advertisers are supplying the most problematic creatives.
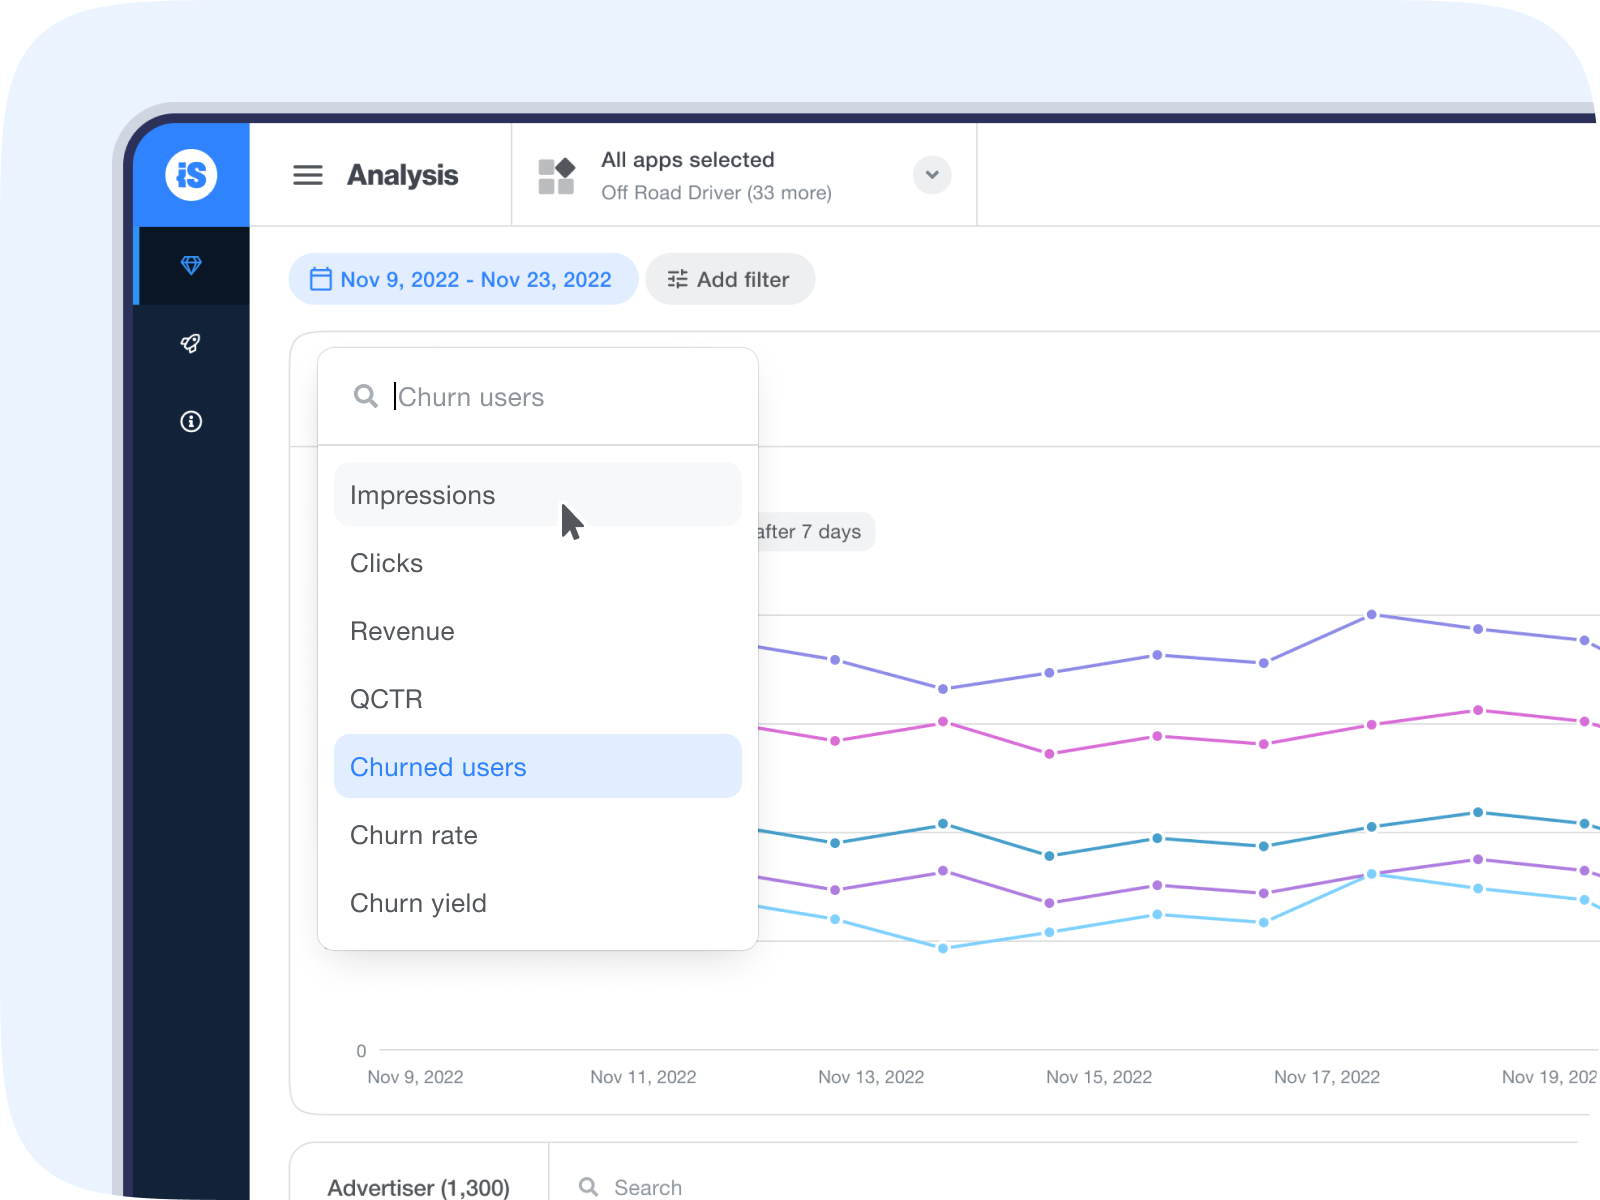
The following metrics are also available:
- Impressions
- Clicks
- QCTR
- Churn users D1/D3/D7/D14
- Churn rate D1/D3/D7/D14
- Churn yield D1/D3/D7/D14
Visit the Ad Quality Glossary to see how these metrics are calculated.
These are the additional break by options:
- Developer
- Apps
- Ad sources
- Countries
- Category
- Platform
- Ad unit
- Creative type
- Content rating
Apply filters to help focus on the data you want to investigate by clicking Add Filter at the top of the page.
The filters and breakdowns you selected will also be applied to the table at the bottom of the page. In addition, when you navigate to the Creatives page, the same filters will be applied.
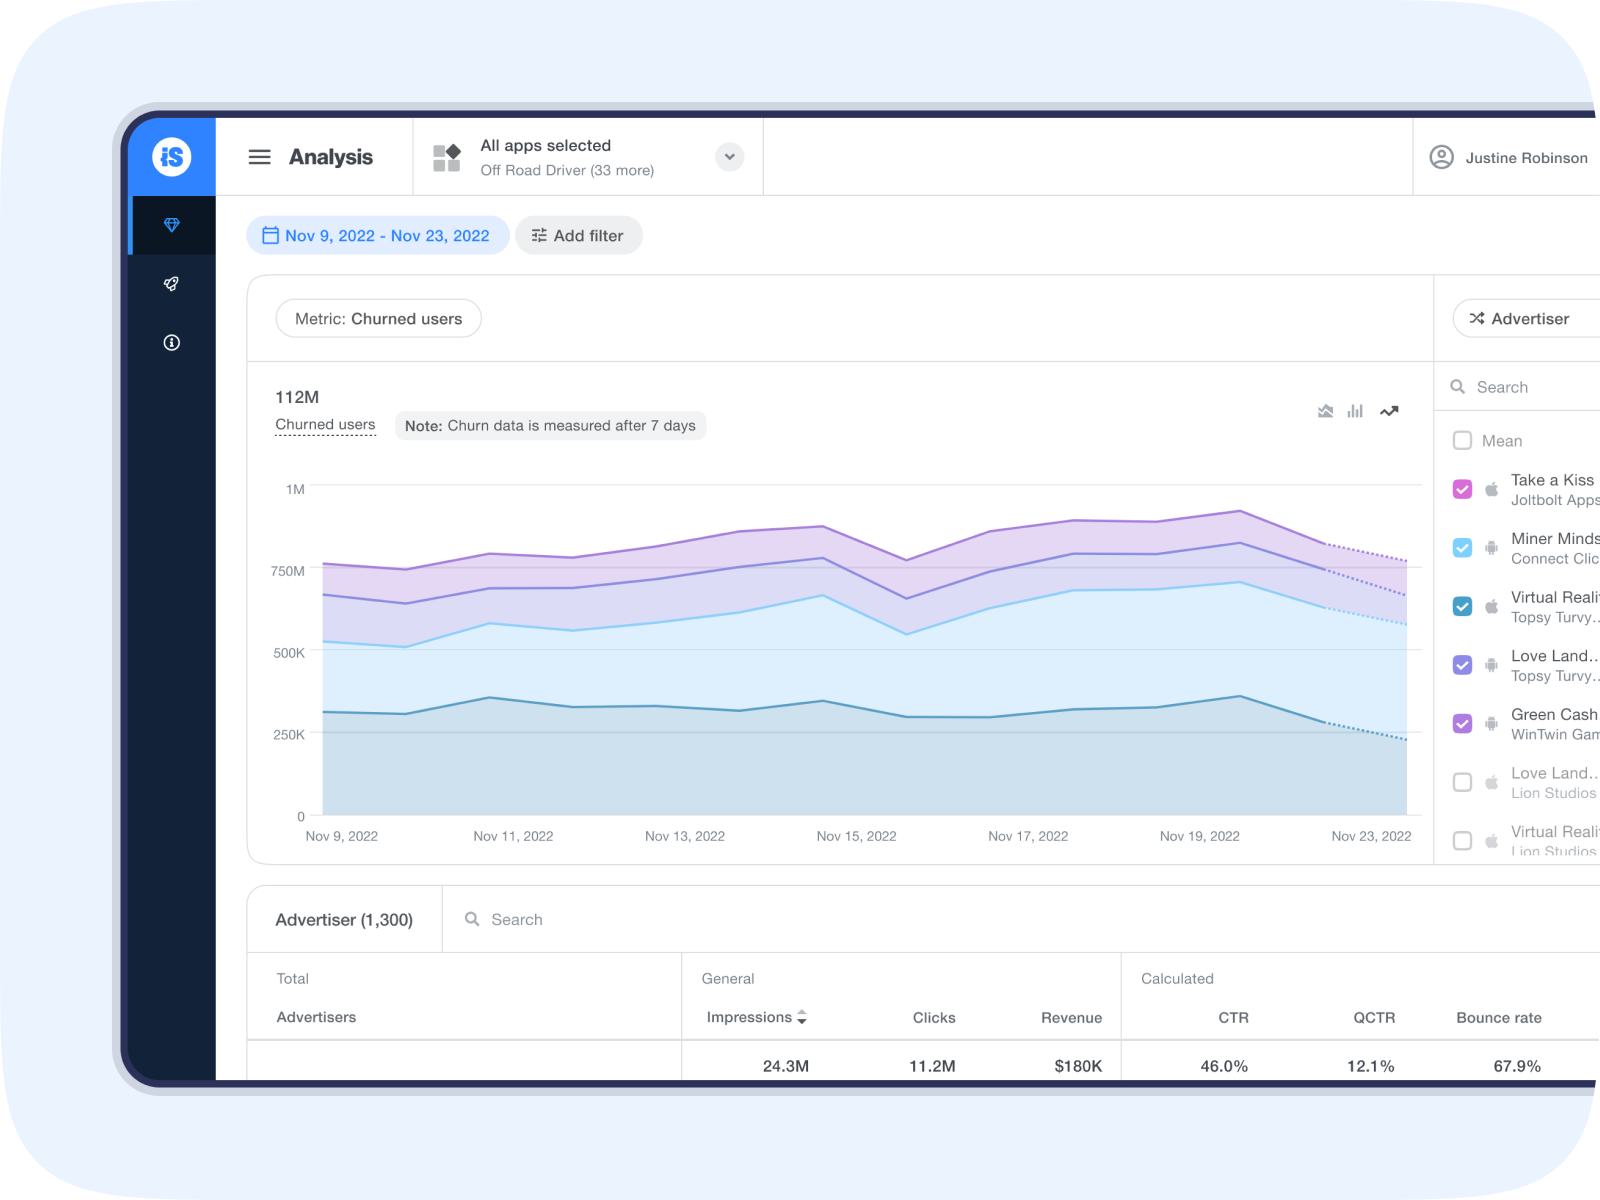
Display options
Choose from 3 different data display options: stacked, bars, and lines (default).
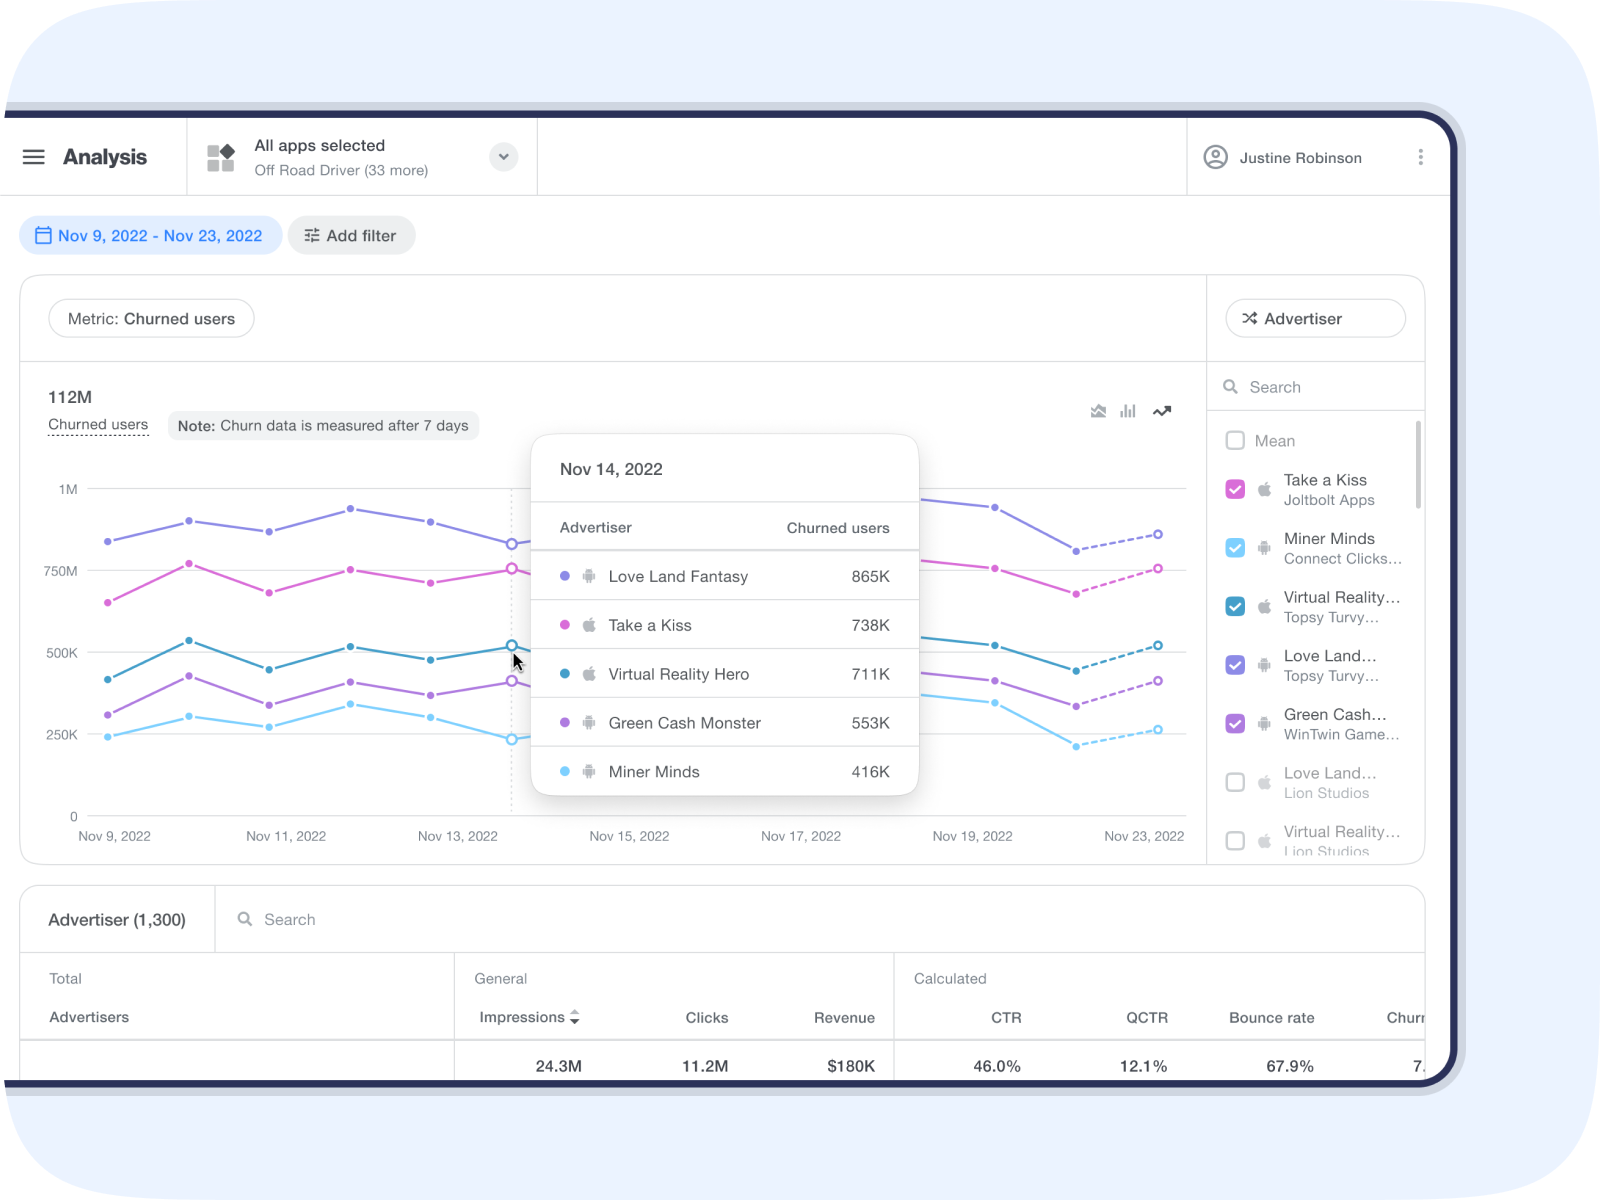
In-graph insights
Once you’ve selected your display options, hover over a particular point in the graph to get more detailed insights.
In-depth reporting
Scroll down to see a table with more granular data based on the filters and breakdowns you selected, including:
- Impressions
- Clicks
- Revenue
- CTR
- QCTR
- Bounce rate
- Ad escape rate
- Churn rate D1
- Churn rate D3
- Churn rate D7
- Churn rate D14
- QClicks
- Hasty clicks
- Proximity clicks
- Auto clicks
- Early clicks
- Ad duration
- Ad closed
- Completed views
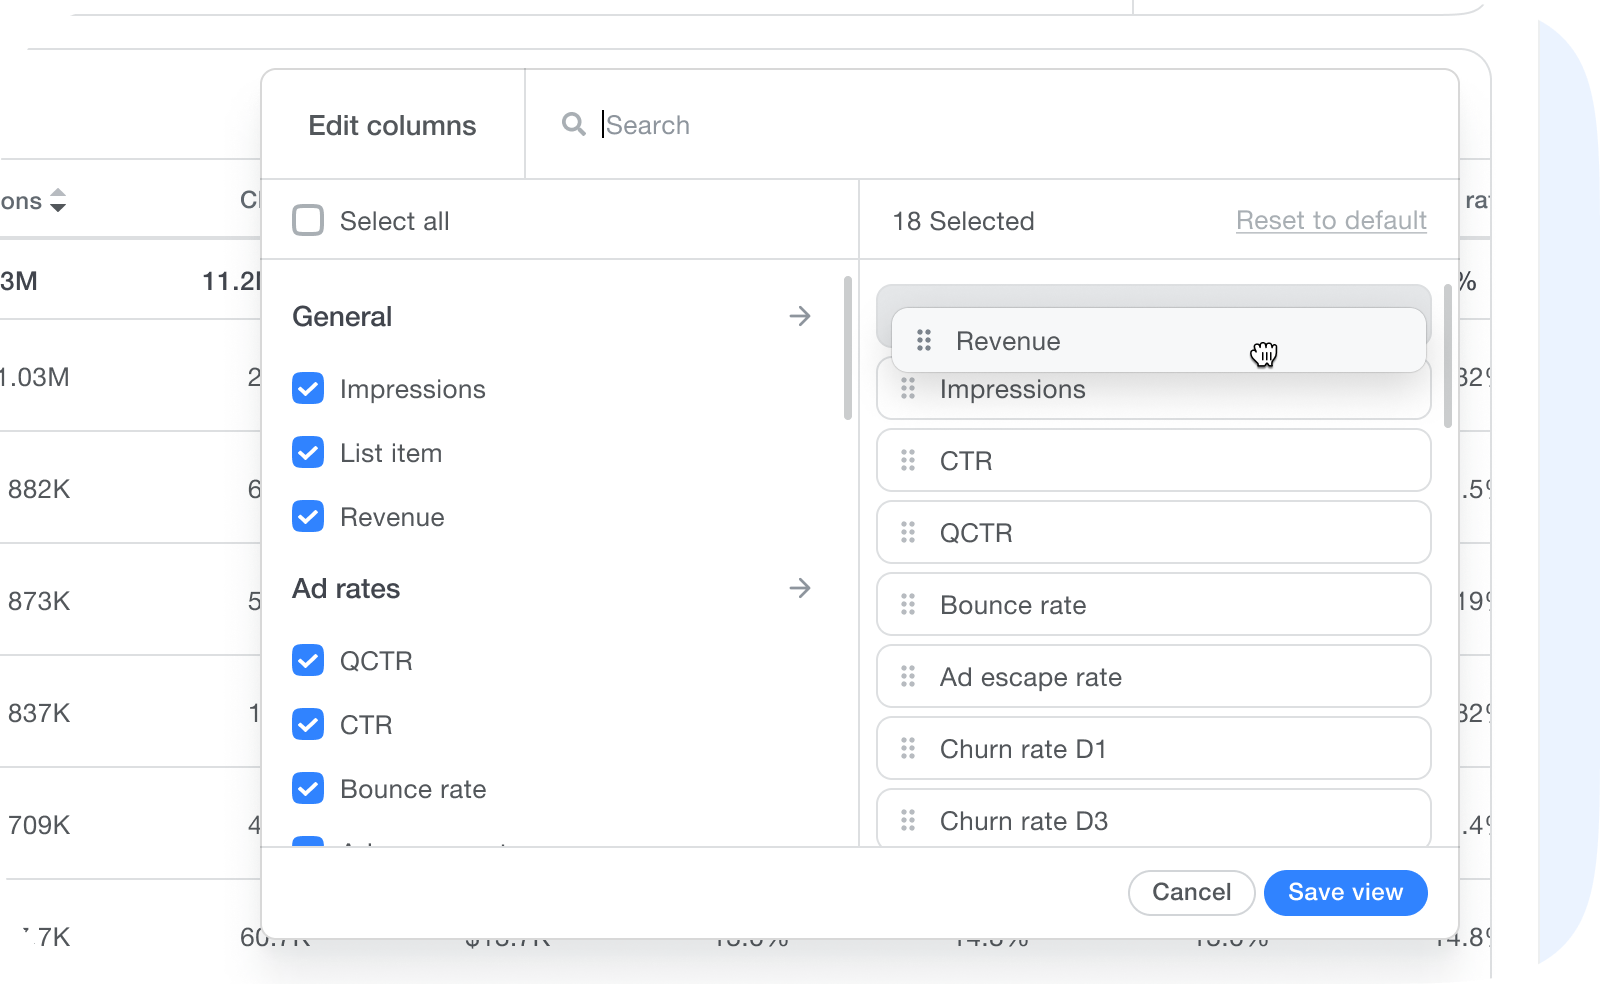
You can choose which metrics you want to see by clicking the column picker icon in the top right corner of the table.
Then, check the metrics you want to see and rearrange the order you want them to appear in the table. Click Save view, and your table will update. Your settings will be saved for your next session.
If you find a potentially problematic creative in the table, navigate to the Creatives page to view the creative and send a report to the relevant ad sources. Learn more