Performance Reports

Unity LevelPlay Performance Reports aim to deliver valuable insights and analytics so you can better understand your monetization performance. With in-depth filters and helpful breakdowns, your Performance Reports provide the necessary granular data you need to make calculated decisions to achieve monetization success.

Step 1. Navigate to Monetization Reports

All apps with at least one active ad unit will appear in your Performance Reports dashboard. To view reports that exclusively show the performance of the ironSource Network, you can find them under ironSource Network. 

To view your Performance Reports, go to Monetize Reports Performance:ironsource-platform-performance-reports

Step 2. Configure Your Reports

If you have saved reports in the past, you can find them in the dropdown accessible in the Report Title. 

ironsource-platform-performance-reports-saved-reports

Filters

Date Range, breakdowns and filters can be found at the top of the page. Use these to deep dive into your app’s performance and better understand your ad activity. These filters make it easier to find specific results and separate the rest of the data to simplify the report.performance-reports-1

  • Apps: Choose to view reports only for specific apps, to isolate the data for certain apps or per app you monetize with ironSource. You can choose to simply include or exclude certain apps.
  • Countries: Refine your reports by country to understand your apps’ performance based on the geo.
    You can choose to simply include or exclude certain countries. 
  • Ad Sources: You can filter your reports by ad source to better understand the performance of a specific network. You can choose to simply include or exclude certain ad sources.
  • Date Range: Choose the time frame for your report. Select any predefined range or create a custom date range.
    ironsource-performance-reports

Breakdowns

Breakdowns can be found on the right side of the graph. Use these to create different views of your data based on the selections you’ve chosen in the filters section. Customize the view even further by selecting how the list is sorted, as well as the checkboxes which control what you see in the graph.

The available breakdowns are:

  • Ad Source
  • Ad Source Instance
  • App
  • App Version
  • ATT status*
  • IDFA
  • GAID
  • Connection Type
  • Country
  • OS versionPlacement
  • Platform
  • SDK Version
  • Segment
  • AB test group
  • Banner size

* ATT status breakdowns enable you to analyze the impact of ATT permissions on your performance. This is relevant only for iOS apps and is available with ironSource SDK 7.1.0+

ATT status is broken down into 4 values:

0 – notDetermined: The value returned if a user has not yet received a request to authorize access to app-related data that can be used for tracking the user or the device.
1 – restricted: The value returned if authorization to access app-related data that can be used for tracking the user or the device is restricted.
2 – denied: The value returned if the user denies authorization to access app-related data that can be used for tracking the user or the device.
3 – authorized: The value returned if the user authorizes access to app-related data that can be used for tracking the user or the device.

Tabs

You can examine your reports for all ad units in the Overview tab or for to view each ad unit separately simply navigate between the tabs.
ironsource-platform-performance-reports-tabs

In the Offerwall tab, you’ll see data for both your ironSource and Tapjoy offerwall as one data set. Break the data by Ad Source to view them separately. 

Important! If your app isn’t monetizing with rewarded videos or interstitial ads on the Tapjoy network through LevelPlay:
  1. Activate the Tapjoy network
  2. Add your Tapjoy SDK Key to the App Settings

Learn how

Formats

You can view your reports in two different formats: Graph and Table.
performance-reports-2

  • The Graph format shows patterns of your data based on the defined breakdowns and filters. You can see the fluctuation of your performance in a visual format, which makes it easier to understand trends and provides a better view of the data over time as a whole.

    Metric Totals in Table You can view a summary of the metrics portrayed in your report in table format, below the graph. The numbers in the table are a total of each metric, i.e. the total revenue, eCPM, impressions, Ad Availability Checks from a given ad source. The table reflects the identical breakdowns and filters you defined for the graph.
    ironsource-performance-reports-3
  • Browse between the metrics by clicking on them. The graph will change according to the selected metric; for example, when selecting ‘eCPM‘, the graph will portray the data for this specific metric.
    ironsource-performance-metric-tabs
  • The Table format presents your data in columns and rows based on the defined breakdowns and filters. You can see exact values alongside dates which makes it easier to compare individual numbers. This format is better to use when you’re trying to understand or compare specific parts of your performance.
    • Click on the headers to reverse the order of the data (i.e., clicking on Date will reverse the order from chronological to reverse chronological).
    • You can extend the number of rows at the bottom of the table up to 500 rows.
    • You will be able to see the total of the report data in the bottom row of the report.
      ironsource-platform-performance-reports-table

Step 3. Define Your Metrics

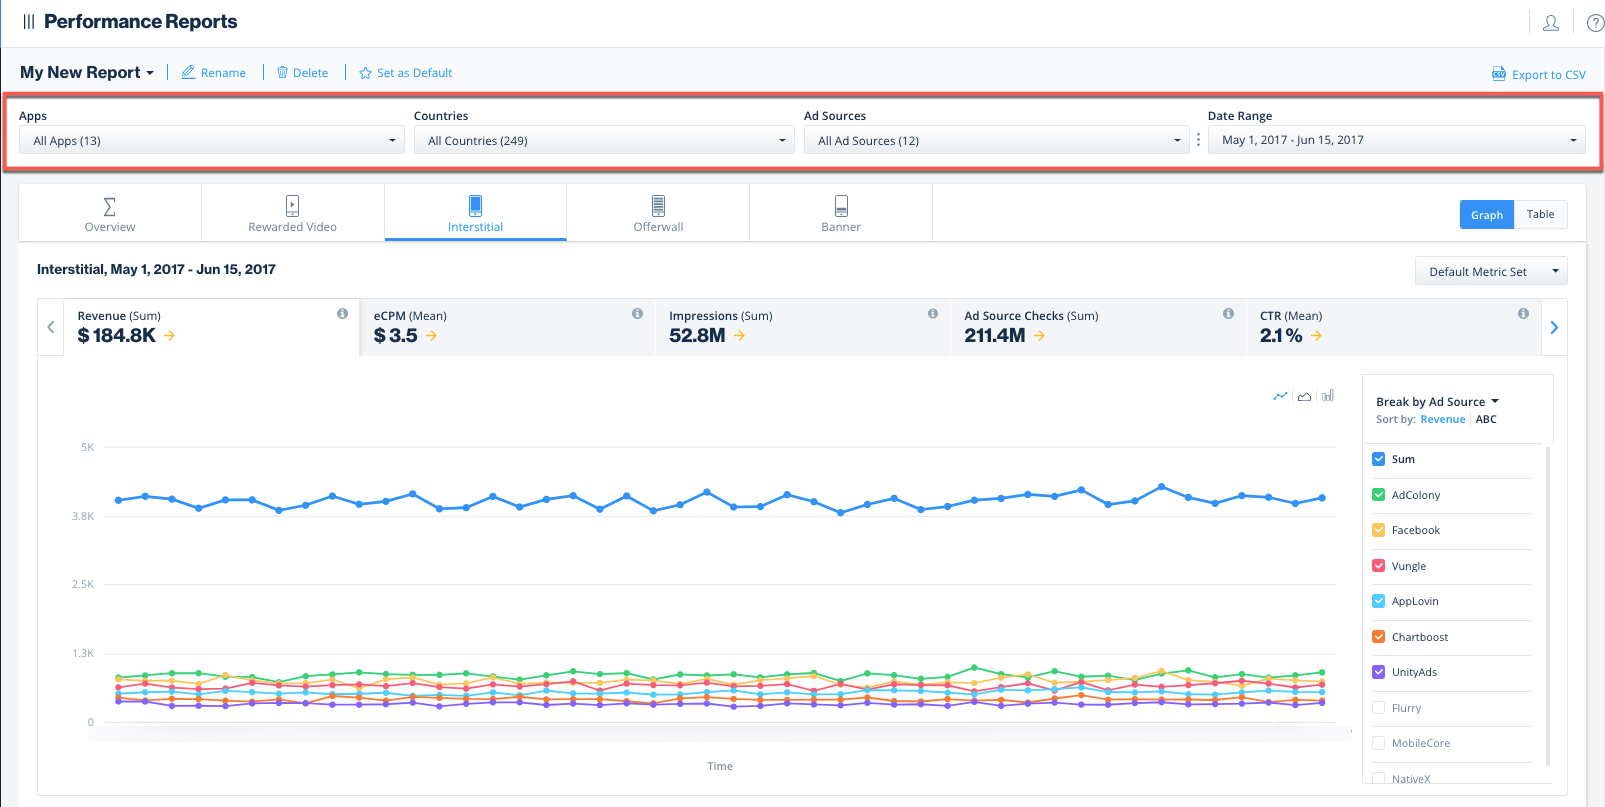
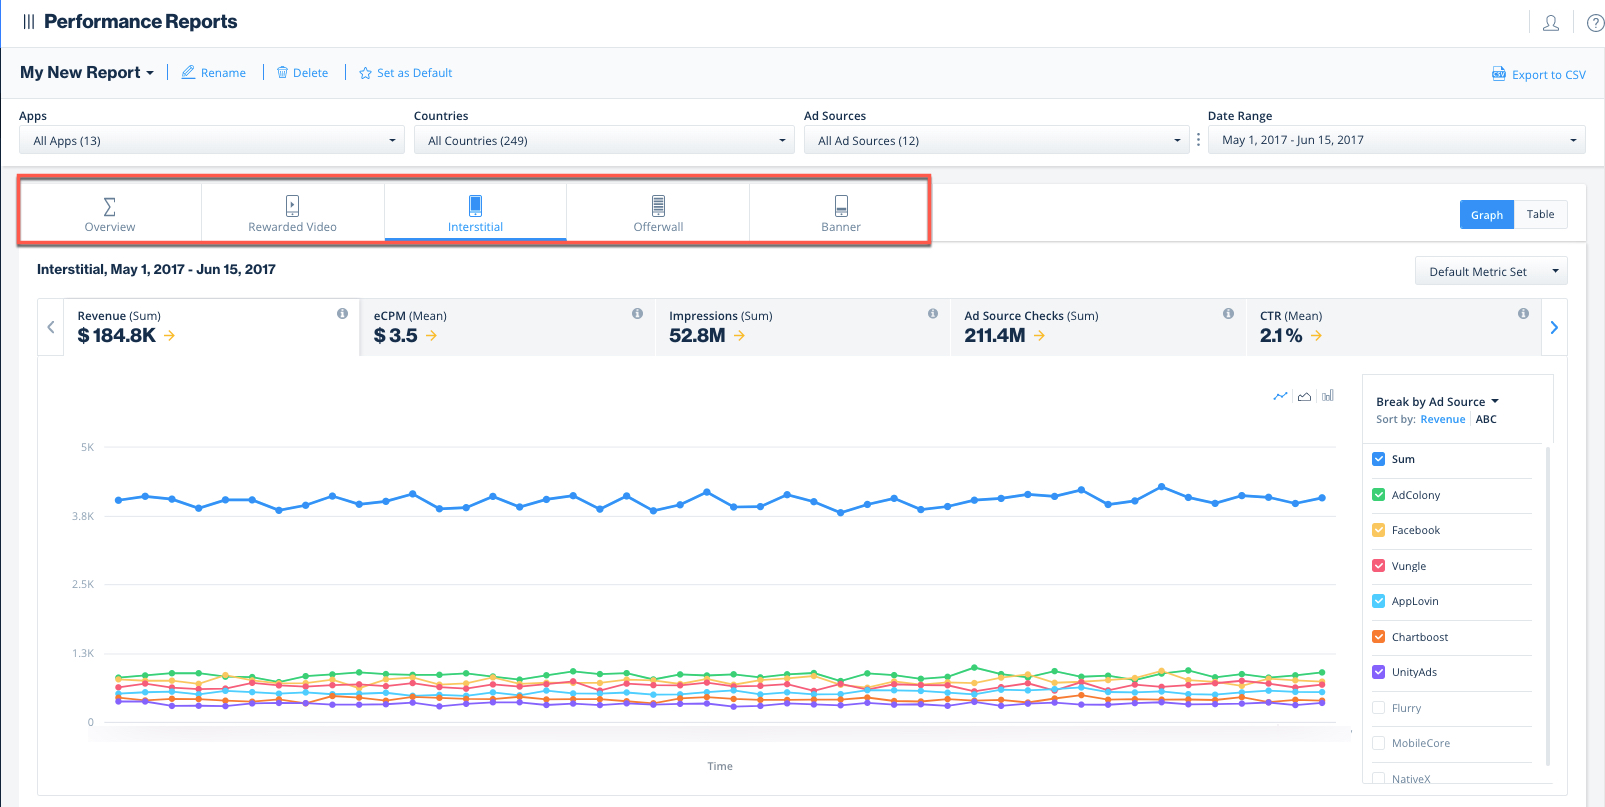
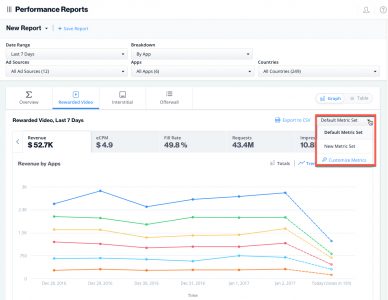
Click on the separate metrics to see dedicated graphs for that metric. You can create custom metric sets in the individual ad unit tabs that provide granular data on your ad performance, by clicking Customize Metrics. You will then be able to create your own metric set and save it for future use.

Note:  The Default Metrics vary slightly based on the ad unit. For example for Interstitial, CTR is part of the Default Metrics Set, while for Rewarded Ad Units, Fill Rate is part of the Default Metrics Set.
ironsource-platform-performance-reports-metric-sets

You can change the metrics for your ‘Default Metric Set‘ or add a new metric set. Your metric sets will be saved per ad unit. 

ironsource-platform-customize-default-metrics

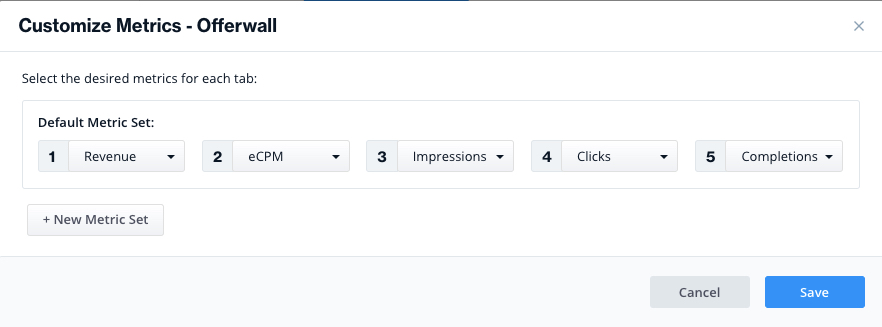
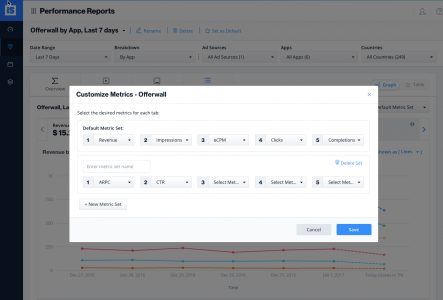
When adding a new metric set, enter a relevant name for the metric set and choose from the list (find a list of all our supported metrics below). Then click ‘Save‘.

ironsource-platform-performance-reports-customize-metrics

Supported Metrics on the Performance Reports Dashboard 

ironSource provides deep insights into your app’s ad performance with a wide range of metrics.  These advanced metrics allow you to understand how well your ad units are performing, which ad source is proving most profitable, etc.; allowing for better implementation and control.

Revenue-based metrics like ARPDAU and eCPM are supported for every breakdown.

Note:  Supported metrics might differ slightly based on the ad unit.

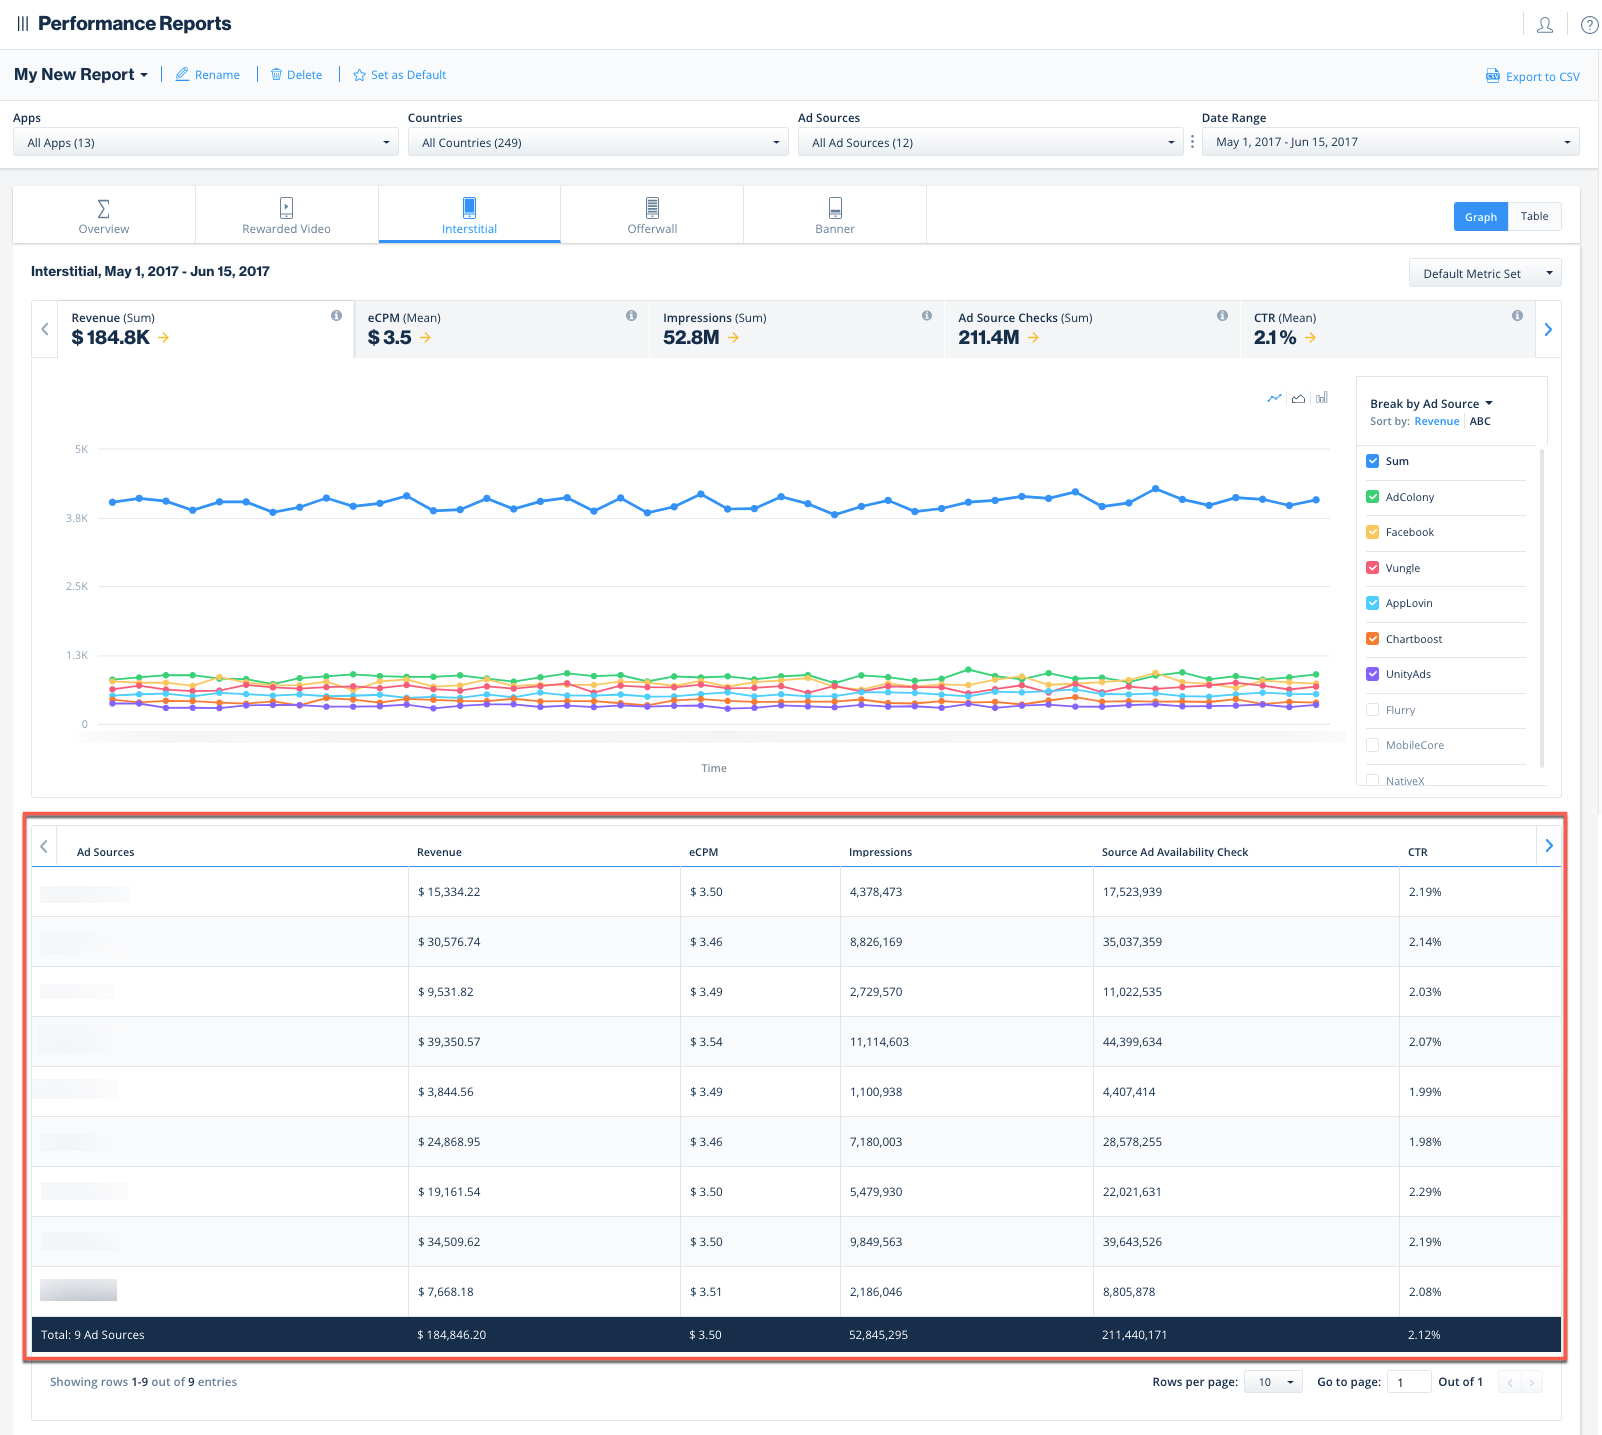
Revenue: The total revenue generated by your ad performance
eCPM: Effective Cost per Thousand Impressions. Calculation: revenue divided by impressions multiplied by 1000
Fill Rate: The rate at which an ad is served following a request to the Mediation layer; calculated as ad fulfillment divided by ad requests multiplied by 100%
Requests: Number of times an ad request has been conveyed to the Mediation layer. The request numbers for individual ad networks will differ if/when breaking down or filtering by ad source
Impressions: Total number of times the ad is shown
Completions: The total number of video completions
Completion Rate:
The rate at which an impression is followed by completion NEW!
Fulfillments: The number of requests that generated a positive response
ARPC: Average Revenue per Completion, the total revenue divided by the number of completions
Imp/ Ful: Impressions per Fulfillment, the total of impressions divided by the total number of fulfillments
Source Ad-Availability Check: The number of times an ad source is asked whether it is ready to show an ad
Source Ad-Availability Response: The number of times an ad source had an ad available to show at the time of the request
Availability Rate: The rate at which an ad source had an ad available when an ad was requested.
Sessions: The sum of single periods of user interaction with your app (each SDK init generates a new session).
Engaged Sessions: The sum of sessions in which a user interacts with an ad
Imp / Session: Impressions per Session, The average amount of ads served throughout a single session
Imp / Engaged Sessions: Impressions per Engaged Session, The average amount of ad impressions during an engaged session

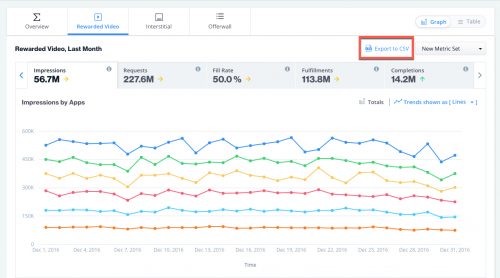
Once you save your metric set, you will be able to see it in the Metric drop-down on the top right of the graph.
ironsource-platform-performance-reports-saved-new-metrics

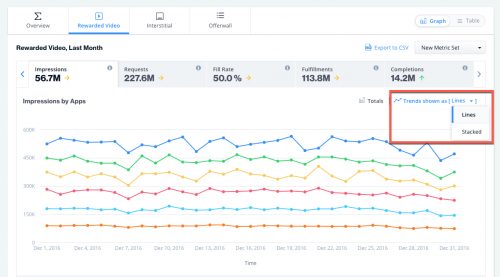
For relevant metrics, you will have the ability to view the data trends in lines or stacked:
ironsource-platform-performance-reports-trends

Step 4. Export Your Data

If you’d like to export a report to save it, click on ‘Export to CSV‘:

ironsource-platform-performance-reports-export-csv

The following window will open and you can verify your breakdowns and metrics (KPIs). Make sure the Date Range is correct. Click ‘Download CSV’ and the file will download to your computer.
ironsource-platform-export-report-data-popup

What’s Next?

Make sure to check out your User Activity Reports to gain valuable insights on how your users interact with your ads.